|
|
 |
| 2 QID
ETF Proshares Ultra short - red |
| Nasdaq
- black |
|
|
| top
|
|
 |
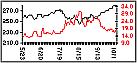
| 3 Ratio
of yield on 10 year bonds / 13 week bills red |
| Nasdaq, black |
| fed
|
|
| top |
Yield Curve Gold
Eagle yield curve calculation "The calculation that I use is
the yield on the 30 year Treasury bond (or 10 yr) divided by the yield
on the short term 3 month Treasury bill and Financial
Sense and Wikipedia
|

 Consumer Credit, Factors
Affecting Reserve Balances, Industrial Production, Capacity
Utilization, Money Stock Measures, Commercial Paper, Country
Exposure Lending Survey, Foreign Exchange Rates, Flow of Funds,
Home Mortgage Disclosure Act Data, Household Debt ratios,
Survey of Consumer Finances,
Consumer Credit, Factors
Affecting Reserve Balances, Industrial Production, Capacity
Utilization, Money Stock Measures, Commercial Paper, Country
Exposure Lending Survey, Foreign Exchange Rates, Flow of Funds,
Home Mortgage Disclosure Act Data, Household Debt ratios,
Survey of Consumer Finances,
|
|
|
|
|
 |
|
|
 |
|
 more on bonds and inflation
|
 |
- Bonds, Overview, can be thought of as a loan,
citizens are the lenders, the borrowers are usually a government,
local municipality or big company. They use the money for
roads, finance factories, fund the federal deficit...etc. You
purchase a bond at 'face value', the pay back date is the 'maturity
date' at a predetermined interest rate or 'coupon'. They're
known as 'fixed income' investments, they assure a steady income ...
less volatile than stocks. Often it is said: When yield goes
up, price goes down ... bonds can be held to maturity or bought and
sold on the open market. The price fluctuates but you will get
the same payout (coupon). Yield:
a figure that captures the the change in price (value) of the
bond. Its the percentage return of the bond at any given
price. Formula: Yield = Coupon / Price ... the yield is simply
the coupon (% rate) ... when the price of the bond fluctuates, the
yield grows or shrinks to compensate in either direction.
ex: $1000 bond with $60 coupon, yield =6% ... but current
yield = $60 / $800 = 7.5% if price drops ... All this is complicated
by how coupons are reinvested and the compounding
effects.
|
| 7 13
Week rates red |
| Nasdaq
- black |
| source data: IRX |
|
| top |
|
 |
- Bond trading
... If you're a bond buyer, you want high yields and then higher
prices once you own it. You would like to pay $800 for a
$1000 bond and price rises are a good thing. For individuals,
short term bonds are the 'safest' and not 'callable' or paid back
early. Rising Inflation
is the biggest threat to buy-and-hold bond
investors. Inflation usually accompanies strong economic
growth and is a bad sign for bonds. Rising prices make today's
dollars worth less in the future and are particularly corrosive to a
30 year bond. The threat of inflation raises bond prices and
yields fall. Inflation erodes the value of bonds. Lower
growth, which normally eases inflationary pressure, is often seen as
positive for bond prices, pressuring yields lower. See above July, Aug, Sept 2007
|
|
|
 |
|
|
 |
|
|
 |
|
|
 |
| 12 Home
Finance Index,
red |
| Fannie
- black |
| Components: RSO,CFC, IMB TMA,
DHI, CTX will be added soon. |
| top
estimated data before Sept 20, 2007
|
|
 |
| 12a Transportation
Index,
red |
| Dow - black |
| Components:
|
| top
Major markets don't experience significant rally
unless the Transportation Index is also rising.
|
|
|
...